

Graphy: The Ultimate AI-Powered Data Visualization Tool Graphy is an advanced AI tool designed to simplify data visualization and analytics. It helps businesses, researchers, and students transform raw data into interactive charts, graphs, and dashboards effortlessly. With its intuitive interface and powerful AI capabilities, Graphy makes data analysis faster and more accessible for everyone
Contents
5 Benefits of Using of Graphy
- Saves Time – AI automates data analysis.
- Enhances Presentations – Professional-looking charts.
- Improves Decision-Making – Clear insights from data.
- Boosts Team Productivity – Real-time collaboration.
- User-Friendly – No coding or design skills needed
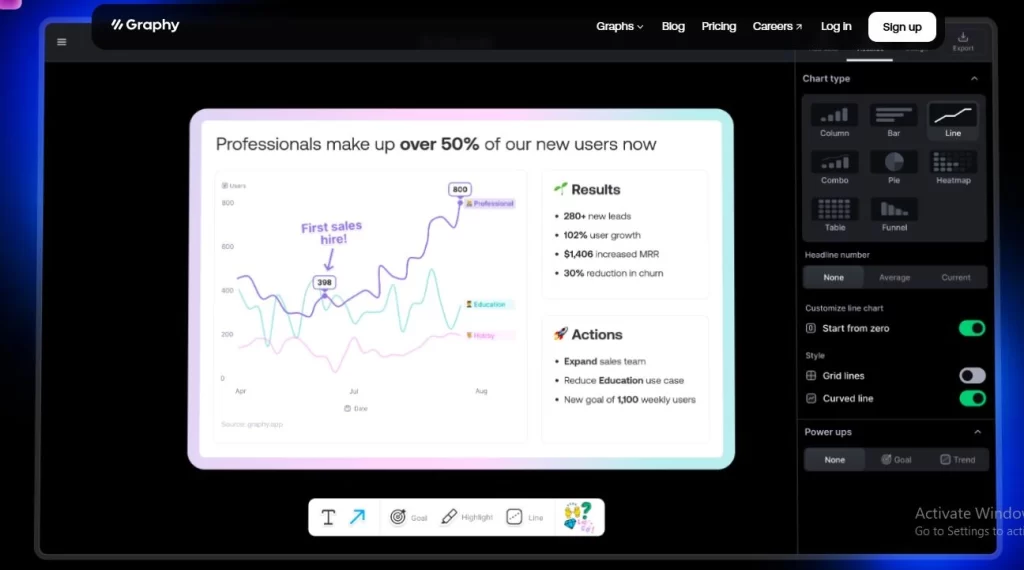
Features of Graphy
- AI-Powered Data Insights: Graphy uses artificial intelligence to analyze data and suggest the best visualization methods. It automatically detects patterns and trends, saving time on manual analysis.
- Interactive Dashboards: Create dynamic dashboards with drag-and-drop functionality. Customize charts, graphs, and tables to present data in a visually appealing way.
- Real-Time Collaboration: Work with team members in real-time. Share reports, edit visualizations, and get instant feedback without switching platforms.
- Multiple Chart Types: Choose from bar graphs, pie charts, line graphs, scatter plots, and more. Graphy supports a wide variety of visualization styles.
- Easy Data Import/Export: Import data from Excel, CSV, Google Sheets, or databases. Export your visualizations as PNG, PDF, or interactive web links
Also Check : Buddy4Study Scholarship Support Programme 2025 for Class 11, 12 and 1st Year UG Students